Tuesday, November 30, 2004

An Artificial Mound?


A Strange Mound on Mars Posted by Hello

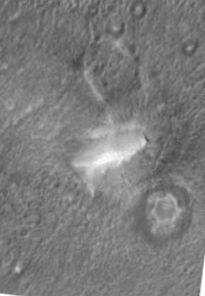
Any one of the three unusual formations on Mars would make one stop for a moment and wonder whether natural forces could explain them. When all three very different formations occur together, it lends a great deal of credence to the the artificiality hypothesis which has been suggested for a number of other formations in this same region of Mars.

The horseshoe shaped depression at the top of the photo is probably the least remarkable of the the three, but it seems tied somehow to the strange mound that appears to have a triangular facet and is roughly bisymmetrical. Not far from the mound is a nearly hexagonal platform which seems very difficult to explain as a natural phenomonen. Actually, the simplest explanation is that these features were built and designed by some intelligent life form and are now eroded and decayed. However, this does not fit well with what we think we know about Mars and natural processes can form many unusual features. How can one judge what might be the truth here? What do you think formed the features in this photograph?

It should be noted that the mound above was seen on the low resolution Viking photos and along with other similar mounds in this area was descibed as being part of a geometric pattern, that suggested an artificial design. The higher resolution photo above provided more detail and instead of debunking the artificiality hypothesis, it seems to support it.

|

Sunday, November 21, 2004

CO2 Through Geologic Time


CO2 Variation through Geologic Time Posted by Hello

The above curves show the broad temperature and CO2 variations back to the beginning of the Paleozoic era. Our current era and the Late Carboniferous-Permian periods stick out as having extremely low temperatures and low atomospheric CO2. Both of these times were also distinct in having glaciations.

This data covers from 600 million years ago to the present. What it shows is that CO2 decreased from the Cambrian high of 7000 PPM through the Paleozoic with the lowest levels reached in the glacial ages of the Late Carboniferous-Permian. During the Mesozoic, CO2 was generaly greater than 1000 PPM and then it decreased to the current low level, which is very similar to that in the Carboniferous-Permian ice ages. There is no evidence for a "runaway greenhouse effect" through all of this Earth history. Why should we worry about such an effect being caused by man's release of CO2 by burning fossil fuels? The answer is we shouldn't. It is never going to happen. If we burned every ounce of coal and petroleum available to us, it would never raise CO2 levels higher than the Mesozoic norm of 1000 PPM. I doubt we could even double the current CO2 level. It is thought that man's current input of CO2 into the atomsphere is about 70 PPM, so you judge what it would take to drive CO2 higher than the Mesozoic norm.

|

Another Temperature Prediction


Malinkovitch Curve vs. Vostok Ice Core Data Posted by Hello

I made a temperature prediction in the previous post by replicating the previous glacial cycle. I knew this was not the best approach because the cycles, although similar, are not exactly the same, so I went looking for a Malinkovitch curve estimated from the astronomical data. It took me awhile to find one that I could post, but I finally found one which is posted above and compared to the Vostok Ice Core Data. The Malinkovitch curve came from this article: No soon Ice Age, says astronomy. In it Czech astronomer Jan Hollan predicts no ice age for at least 130,000 years.

His prediction is based on the curve above which shows no periods of extremely low insolation at latitude 65N for the next 130,000 years (the presumed driver for continental glaciation). There appears to be the possibility of an extended interglacial age.

I noticed several interesting things about these curves. One is that the first peak I show on the Malinkovitch curve above, appears to have had almost no affect on temperature. This peak occured during one of the coldest epics, but did not spur an interglacial. The third peak on the curve did spur an interglacial, but it was not that much higher than the first peak which is also higher than the peak that spurred the current interglacial epic.

A fair correspondence between the Malinkovitch curve and temperatures in the last 100,000 glacial cycle is evident. The details of the curve which don't match the Malinkovitch cycles are probably related to sunspot cycles and biofeedback.

It appears that most of the decrease in solar insolation from its peak at the beginning of our currrent interglacial has already occured. Only a small decrease compared to what has already occurred is in store for the future following by another rise in less than 500 years. Since only a small decrease in temperature has occured since the Holocne interglacial maximum, it is probably not reasonable to expect any precipitous temperature drops in the near future, as I speculated earlier. Clearly then, there are changes in Earth's climate system which have caused the Holocene epic to have a fairly stable temperature as compared to past glacial ages. The future for the next 100,000 also looks good, as the Malinkovitch cycles which were driving the glaciation are in a subdued phase with no deep troughs of extremely low insolation at high northern latitudes for an extended time period.

So back to the original debate- should we be concerned with global warming. The answer in my mind is still no. There are many factors driving climate and we don't really understand how they all interact to create the climate we have. To pick out one influence- CO2 release by the workings of men, and believe it is paramount in causing climate change is absurd. Unless, we have a model that accounts for all variables and is able to match past climate history, it is simply wild speculation and should not be a basis for public policy.

|

Friday, November 19, 2004

Future Global Temperature Prediction


Ice Core Temperature Data with Future Projection Posted by Hello

I replicated the temperature data for the last ice age and overlayed it on the current Holocene interglacial temperature record. This graphically shows three interesting things:

(1) The Holocene peak temperature to date is significantly lower than that seen in the last interglacial.

(2) The precipitous temperature decline seen after the last three interglacial peaks has not occurred in the Holocene so far. Instead there has been a gradual decline since the Holocene peak with relatively constant temperature. This is the time in which our civilization has developed.

(3) The temperature decline which will lead us to the next glacial epic is overdue. Based on the previous temperature record, this decline should be precipitous, as shown by the red line temperature projection above.

Since these temperature fluctuations are based on solar variation driven by changing orbital eccentricity, earth axis tilt and precession (Milankovitch cycles), It is almost certain that they will continue with a nearly identical pattern to those seen in the past. If man's release of CO2 is warming the climate, it is fighting a downward temperature trend that would appear to be overwhelming.

Although I do not know for certain, I am willing to bet that the computer climate models that are predicting global warming are using a constant solar input and not taking the Milankovitch cycles into account. If there were a model that took the variation in solar input into account, would it show that man's environmental impact has been to stabilize global cooling and save us from the coming ice age, or would it show that man's impact has been to induce global warming leading to anomalously high and dangerous temperatures for our planet, as has been claimed. I feel that almost certainly, the former is correct and the latter is really bad science.

|

Thursday, November 18, 2004

Questions about Titan


Saturn's Moon, Titan, False Color Image from the Cassini-Huygens Spacecraft Posted by Hello

This article; Titan Photos Pose New Questions , was interesting to me. Mostly it asks a lot of questions without providing any answers. I guess this is what I like- asking a lot of questions.

The photos of Titan have been disappointing to me. The one here is the best that I have seen. The simple fact is you really don't see much in most of the pictures; the planet is blurred and veiled in the haze of its atomosphere. I am still watching though, as I am quite interested in what might be found on this moon. This JPL website shows some more pictures from Cassini-Huygens.

|

Maybe Global Warming is Good?


Present Climate Posted by Hello

Comparing the present Earth to the picture below of the Earth at the the end of the last ice age, the question that should be asked in the global warming debate, is which Earth do you prefer? The Earth of 18,000 years ago was dominantly desert and glacial ice with small forested areas. The present Earth seems more suitable for our civilization and most other life forms. The global temperature curves for the last 400,000 years show that we are hanging precipitously near the end of a short interglacial epic. A fall in Earth's temperature and continued glaciation in the future is as good a scientific prediction, as the theory that the sun will continue to shine for billions of years in the future. That mankind's production of CO2 could alter this future is highly unlikely. The facts simply do not support this contention. If we could, the result would be more green on the map above and not less. Once again- which would you prefer? A constant climate is not a real option, as amply demonstrated by geologic history.

|


Ice Age Climate Posted by Hello

|

Wednesday, November 17, 2004

Global Warming in Context


Ice Core Data Posted by Hello

I attended a lecture on global warming this evening and did some more research on the internet. This article: Global Warming:A Chilling Perspective, puts the whole issue in the proper context. The chart above shows global temperature variations over the last 400,000 years. What is evident is that 100,000 year cycles are being repeated. Each cycle ends with extreme cold followed by a very rapid rise in temperature. Temperature hits a peak and drops sharply followed by an erratic downward temperature trend that ends at a glacial maximum, followed by another rapid rise in temperature. The peak periods are very short. The one we are currently in is much longer than the three peak periods that preceed it. The peak temperature of the last three peaks is higher than any we have seen yet. These cycles are driven by cycles in the earth's rotation and orbit eccentricity. There is nothing we can do that can change the cycles and no reason to believe we have exited the ice ages, since they are driven by plate tectonics which have now put the continents at the equator blocking global circulation and cooling the planet. The interglacial period we are in must end soon. The CO2 we have released into the atomosphere may have slowed this process, but it is unlikely to reverse it. Instead of bemoaning global warming, we should rejoice in it, because the coming ice age will result in a less habitable planet, not more. If we can hold it back, we should be happy.

|

Election Fraud?

More on possible election fraud can be found in this article: US election fraud scandal looms?

|

Monday, November 15, 2004

Colin Powell quits at State

This is not a surprising announcement: Colin Powell quits at State, but it is still upsetting. The only apparent voice of reason within Bush's inner circle will soon be gone. They did not heed what he told them, but at least they had to listen. Now there will be little or nothing to mitigate the idiocy of the Bush team. Where they may lead us after Iraq is scary to think about.

|

Thursday, November 11, 2004

Free Photos


Amazing Photo! Posted by Hello

This photo was one of the recent daily photos at Webshots.com. I recommend checking out this website. It offers free screensaver and wallpaper software and thousands of free photos, with new ones every day. I like to check out the new photos every day. Every once in a while there is one like the one above that astounds you and seems to make you see the world in a whole new light.

|

Monday, November 08, 2004


Spam's Origins Posted by Hello

This map shows where all that hated spam is coming from. Here is a "Bushie" solution for spam. Nuke all the red spots on this map and warn the others that they will suffer the same fate, unless they curtail the spam. This solution has the added advantage that a Republican victory will be assured in the next election, as a lot of the Democratic leaning areas will be eliminated, along with a bunch of hated Frenchies, Commies, and Japs.

|

Florida Election Anomalies


Some Florida Election Results by County Posted by Hello

Is it reasonable to believe that in Holmes Co., Florida, where 72.7% of the voters are registered Democrats, that Bush won with 77.25% of the vote? This is just one example of the anomalous results noted in Florida. Here are more.

|

Did Bush Really Win?

This article: Evidence Mounts That The Vote May Have Been Hacked suggests that Bush might not have won the election on November 2, he might have stolen it. Naturally, I was very skeptical when I first began to read it, expecting democratic sour grapes, but the evidence of possible foul play is fairly persuasive. There seems to a big question out there. The exit polls showed Kerry winning a number of key states that later went to Bush. The Bush side is claiming foul play in the exit polls. Could this be a smokescreen for their own foul play? The anomalies this article points out between counties that used touch screen voting machines that were later tabulated by a single Windows PC and those using optical scanners are difficult if not impossible to explain, other than by foul play.

Before the election, I thought the vote would be close and Ohio would be the crucial state. Being a native Ohioan, where my parents still live, I thought I understood how Ohio would vote in this election and I was certain Kerry would win Ohio and the election. I still cannot believe that Bush won Ohio. Maybe he didn't?

It is not hard to imagine that some people in Bush's camp would be willing to cheat to win an election. They view Kerry and all of liberal stripe as Satan's handmaidens. When you are fighting for God, against the Devil and protecting America from the devil terrorists at the same time, I am sure you would do anything to win for your side. The scary thing that this article seems to show is that cheating would not be that hard to do. Given motive and opportunity, can it really be doubted what was done?

|

Free Chess Game

Here is a cool free chess game: Thinking Machine 4. Check it out!

|

Friday, November 05, 2004

Global Warming and CO2

This article in the AAPG Bulletin: Climate change: Conflict of observational science, theory, and politics, should be required reading for anyone concerned about whether global warming is being caused by our industrial society's release of CO2 into the atomosphere. The case that this is true is far from certain, although many people seem to assume it is without looking at any of the data. Some of the data from this article is shown in the posted graphs seen here.

What these graphs show is that since the Cretaceous, the Earth has been in a major cooling trend. In recent times (the Pleistocene) extreme cooling is evident (the ice ages) with short, warm interglacials. We are currently in the longest interglacial of this time period. The current global temperature is nearly 3 degrees warmer than the temperatures in the Mediveal warm period (1000-1200 A.D.) and less than 1 degree warmer than "the Little Ice Age" (1400-1850 A.D.).

Temperature does appear to be rising since 1980, but the graphs shows it may be driven by increasing irradiance from the sun. Additionally, from about 1940 to 1980 temperature was going down, even while the sun's irradiance spiked. Global war and nuclear tests may be responsible for this, but here we speculate that man's influence is driving the temperature down and not up.

The final graph details the cooling trend over the last 10,000 years. What this graph tells me is that the real and strong trend is cooling, leading us toward a new glacial epic. The minor heating evident only since 1980 is not really significant and unlikely to continue, even enough to return global temperature to where it was in Medieval times. The precipitous drops in temperature characteristic of the Pleistocene epoch are the danger we should actually fear. Perhaps it is only our release of CO2 into the atomosphere that has kept this tiger at bay.

|


Sun's Irradiance Appears to be a Major Driver of Global Temperature Posted by Hello

|


Present Temperature Compared to The Little Ice Age and Medieval Times Posted by Hello

|


Decreasing Global Temperature from Cretaceous to the Present Posted by Hello

|


Cooling Trend for the Last 10,000 Years Posted by Hello

|

Thursday, November 04, 2004

Earth or Mars?


Sedimentary Rocks in Valles Marineris, Mars

Is this picture of Earth or Mars? It sure looks a lot like some places on Earth. It is actually some exposed bedrock in the canyon named "Valles Marineris" on Mars. You can follow this link to the original picture and more pictures of: Martian sedimentary rocks.

A lot of these sedimentary rocks have all the characteristics of water laid sediments. The evidence for abundant water on Mars at some point or points in its history is pretty overwhelming. The big question is; where did all the water go? How long ago and is there any left are two other big questions. I don't have any reason to believe this, but I just have a feeling that the water was there, not so very long ago. That most of it disappeared billions of year ago, just does not seem reasonable somehow.

Posted by Hello

|